
Written By: Stephanie Rojas | November 18, 2026
Time to Read 12 Minutes
Houston led the country in new-construction home sales in January and February 2026, with 3,535 sales. A Houston new construction market analysis also shows the region’s weight in permit activity: Houston issued 9,239 residential permits in those two months, while only New York City and Dallas issued more. Across Texas, 17,059 permits were recorded in Q1 2026, down 12% from Q1 2025.
That strength doesn’t mean every part of the market is moving at the same pace, or that a new home costs only a little more. In Harris County, the median new-home price in 2023 was almost 20% higher than the median existing-home price. Where sales cluster, how Houston contributes to Texas construction, and how buyers should interpret that premium all matter when sizing up a deal.
This analysis brings those pieces together. See how new-home sales are distributed across Harris, Fort Bend, and Montgomery counties, what permit trends suggest about Houston’s statewide role, and how new- and existing-home prices compare. Use these figures to understand local demand and put an investment property’s purchase assumptions in context.
New-home sales in Greater Houston are spread unevenly across counties and neighborhoods. Harris County recorded nearly 10,000 new-home sales in 2023, while Fort Bend County recorded 3,685 and Montgomery County recorded 6,076. Those county totals show why a regional sales figure can hide different local patterns. A Houston new construction market analysis is more useful when it separates countywide activity from neighborhood-level concentrations.
Sales growth since 2011 has also varied by county. Harris County sales rose from 4,720 in 2011 to 9,733 in 2023. Fort Bend County increased from 2,474 to 3,685 over the same years. Montgomery County recorded the sharpest increase among these three, rising from 1,046 to 6,076. For investors, those comparisons help identify where new-home activity expanded most over the period, rather than assuming every county followed the same trajectory.
Within Harris County, development has leaned outward. From January 2019 through December 2023, 63% of new-home sales occurred beyond Beltway 8. That pattern places much of the county’s new-build activity outside the inner loop. Cypress South was a notable concentration: almost one in five new Harris County homes sold in 2023 were in that neighborhood. Countywide totals alone would miss this local clustering.
Activity was not evenly distributed across the county’s neighborhoods. From 2019 through 2023, 37 of Harris County’s 143 neighborhoods recorded 10 or fewer new-home sales. In contrast, Cypress South accounted for a substantial share of 2023 sales. This gap matters when evaluating a specific location: a county with strong aggregate activity can still contain neighborhoods with limited new-build turnover. More than 98% of homes in the analysis were single-family, so these patterns primarily describe that market segment.
Mortgage rates and builder incentives can shift buyer demand by changing the monthly cost or upfront appeal of a new home. The average mortgage rate was 7.33% in October 2026; incentives such as closing-cost assistance or rate buydowns can make a builder’s offer more attractive, though their terms vary.
Use county and neighborhood data in sequence. First, compare Harris, Fort Bend, and Montgomery County sales trends. Next, locate the target neighborhood and consider its share of county activity, as the Cypress South example illustrates. Then assess whether sales concentration reflects a broad county pattern or a localized pocket. That approach gives a more grounded view of demand than relying on a single Greater Houston total, especially where 37 Harris County neighborhoods had limited sales across the five-year period.
Houston remains a major contributor to Texas residential construction, but permit activity is easing. Texas recorded 17,059 new residential construction permits in Q1 2026, down 12% from Q1 2025. Houston recorded 8,128 permits, an 11% decrease. The smaller decline in Houston points to greater resilience than the statewide trend, while still showing a slowdown. Permit counts measure authorized construction, not completed homes or sales, so treat them as an early indicator rather than a direct measure of housing supply.
Activity also varies across the Houston region. Harris County recorded 3,266 permits in Q1 2026, 23% fewer than in Q1 2025. Montgomery County recorded 2,267, down 14%. Fort Bend County moved in the other direction, with 1,591 permits, 11% more than a year earlier. This contrast matters: a regional slowdown can coexist with county-level growth. Investors assessing Houston should compare the county trend with the specific location being considered.
Texas’s large metros also compete for new-build activity. Dallas recorded 5,209 permits in Q1 2026, down 25% from Q1 2025. Austin recorded 2,136 through March, up 29%, while San Antonio recorded 1,586, down 10%. Four Texas cities ranked among the top 10 for new-home construction in the report. These figures show a varied statewide market, not a uniform shift that affects every metro equally.
For Houston projects, applicable permits, codes, and regulations depend on the parcel’s jurisdiction and the project’s scope. The local authority determines required approvals and code standards, so there is no single permit list for every Houston-area property. A site within Houston may face a different review process from one in another county.
Flood exposure, drainage, and insurance costs can also affect a project’s economics. Site and drainage conditions may shape design and construction decisions, while flood exposure can influence insurance requirements and premiums. Assess these factors alongside purchase assumptions: a property’s location and drainage characteristics can matter as much as its county’s permit trend.
Use a simple comparison to read the permit data:
This sequence separates broad market direction from property-level conditions. Houston’s 8,128 Q1 permits show the city remains a substantial part of Texas construction, while county differences and site requirements shape what that activity means for an individual investment.
In Harris County, new homes carried a clear price premium in both 2011 and 2023. That gap was almost 20%. The comparison gives investors a local benchmark, but it doesn’t mean every new property costs more than every resale. Prices vary by neighborhood, property condition, and features.
The premium was wider in 2011. Harris County’s median new home sold for $199,900, while the median existing home sold for $130,000. That represented a 54% premium. By 2023, the relative gap had narrowed to almost 20%. The trend suggests buyers’ choice between new and existing homes depends on more than the headline price, and that the premium can shift over time.
Size alone doesn’t explain the 2023 difference. The median new home in Harris County measured 2,029 square feet, compared with 2,040 square feet for the median existing home. The new-home median was therefore slightly smaller, despite its higher price. Compare location, condition, layout, and included features before treating the price gap as a direct measure of value.
Key risks and costs include paying a premium the resale market may not support, as well as financing and ownership expenses. In Houston, compare the purchase price with nearby existing-home values and account for the property’s condition, insurance, taxes, and any remaining construction work.
Affordability also depends on income and financing, not only the sales price. By the article’s calculation, Harris County’s 2023 median new-home price was affordable to a household earning around $113,000 per year. Treat that as a benchmark, not a universal affordability threshold. A buyer’s available funds, borrowing terms, recurring costs, and investment goals can change what a purchase makes sense for.
For an investment comparison, use the same assumptions for both property types. Start with the 2023 county medians, then compare a specific new home with nearby existing properties. Adjust for differences in size, condition, location, and features. The 2,029-square-foot new-home median and 2,040-square-foot existing-home median show why size alone may not explain the premium.
Finally, test whether expected resale value supports the higher entry price. The 2011 premium of 54% and the 2023 premium of almost 20% show that the gap has changed substantially. A strong deal analysis weighs the property’s specific advantages against its purchase price and ongoing costs, rather than assuming new construction automatically commands the same premium in every Houston-area neighborhood.
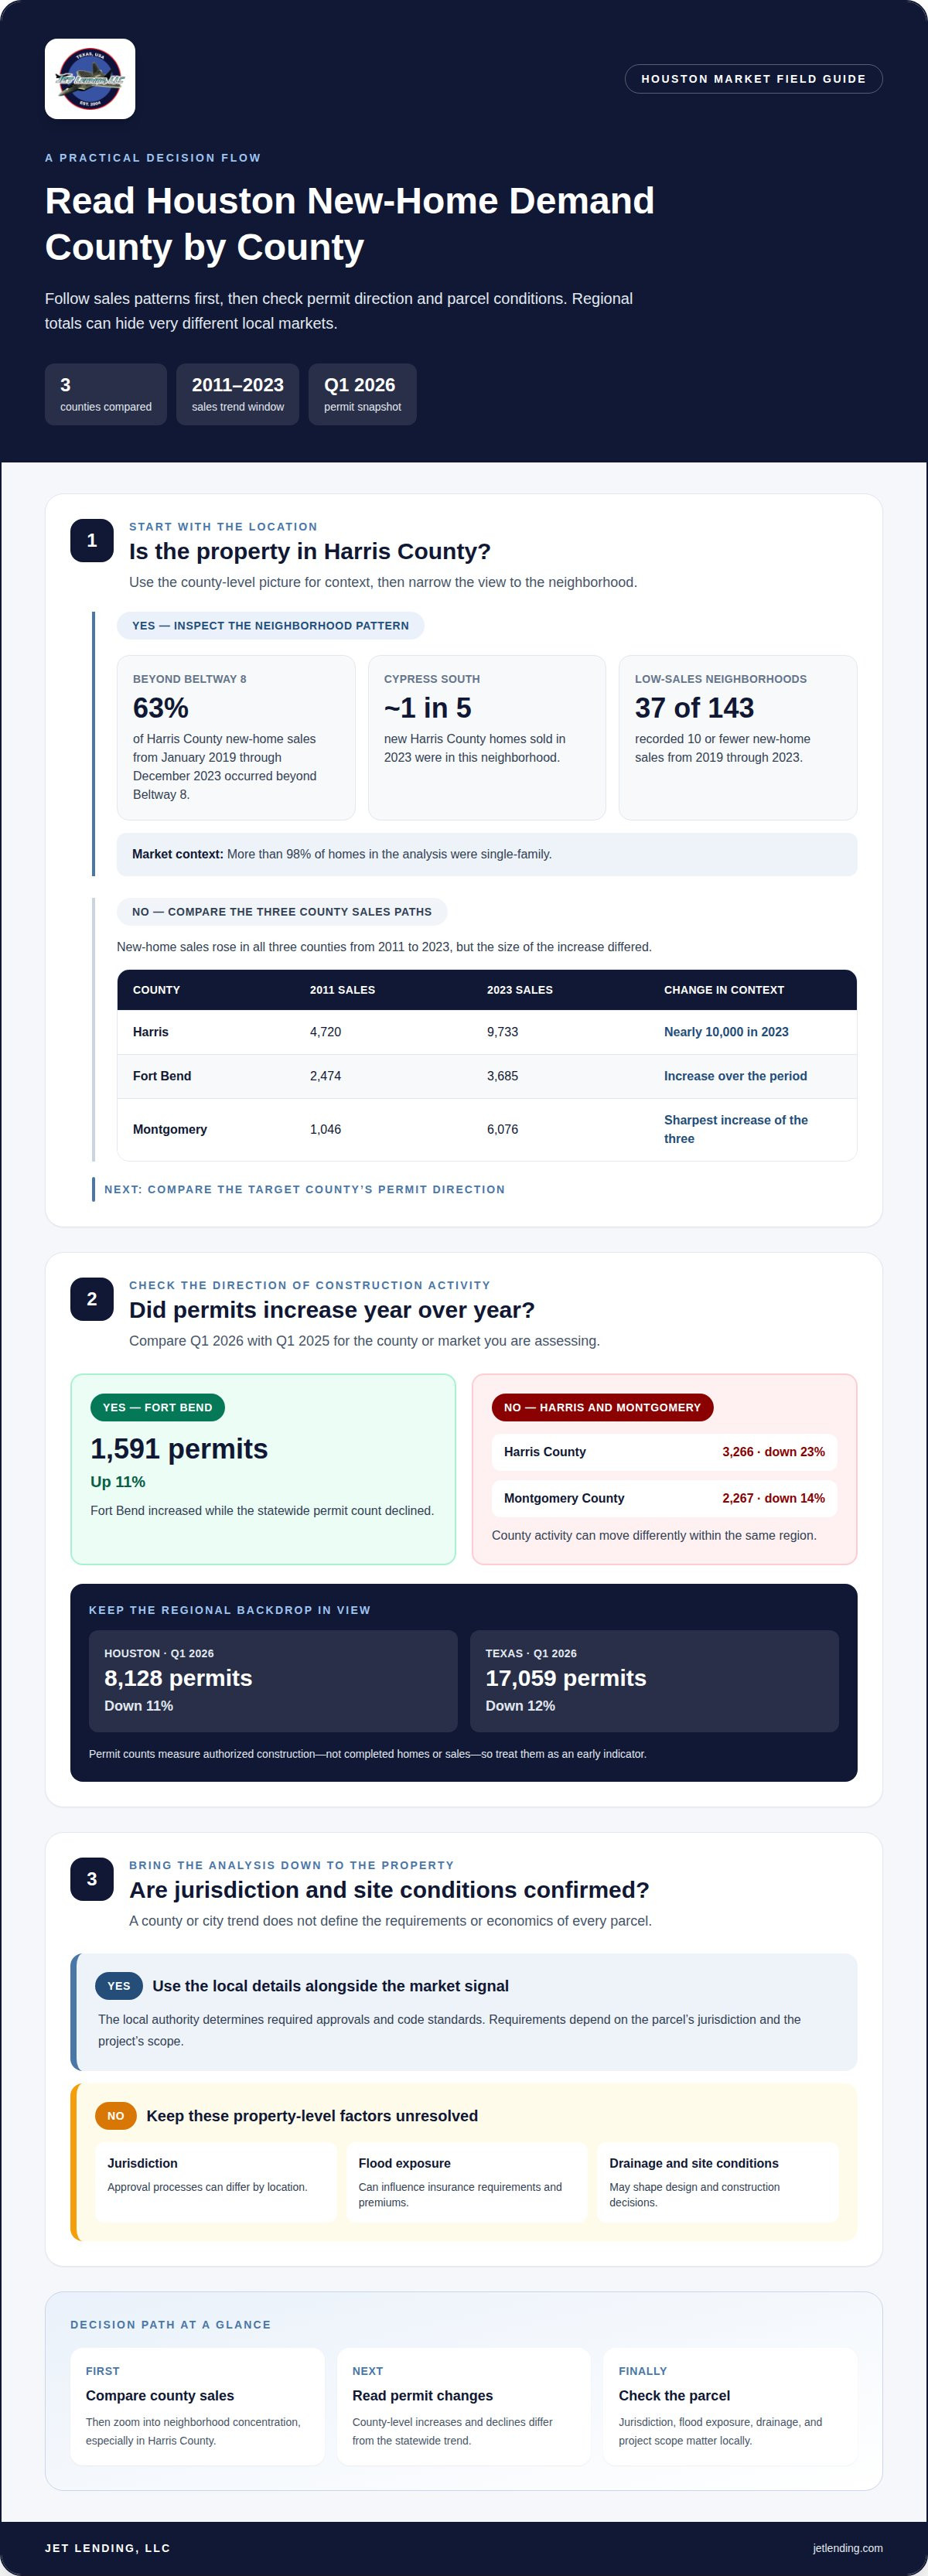
Harris, Fort Bend, and Montgomery counties form three distinct centers of Houston-area new-home activity. Their sales histories show growth in each county, but at different scales. Harris County recorded the largest total in 2023, while Montgomery County’s increase since 2011 was especially pronounced. Fort Bend County also expanded, though its 2023 total remained below the other two. Read these county patterns separately before using regional sales as an investment signal.
Houston recorded 3,535 new-construction home sales in January and February 2026, ranking first for new-build sales in that comparison. That city-level result provides a current snapshot, while the county figures describe longer-term differences. Keep the geographies and time periods distinct: a two-month Houston count cannot be directly compared with full-year county totals.
Harris County combines the region’s largest county-level sales base with sharp neighborhood contrasts. Almost one in five new homes sold there in 2023 were in Cypress South. Yet 37 of the county’s 143 neighborhoods recorded 10 or fewer new-home sales from 2019 through 2023. This spread means a strong county total doesn’t automatically indicate equally active demand in every neighborhood.
Fort Bend and Montgomery counties offer different comparison points. Fort Bend’s new-home sales increased between 2011 and 2023, while Montgomery County grew from a smaller earlier base and posted a larger rise over that period. These trends help frame local demand, but they don’t establish which county will perform best next. A property’s location and comparable nearby sales remain central to a deal assessment.
For the year-over-year view, Greater Houston’s October 2026 single-family sales totaled 6,348, down 14.9% from a year earlier. Active single-family listings reached 40,253, up 6.8%, and supply stood at 5.5 months. These are regionwide figures, not new-build-only counts, so use them as broader market context rather than as a direct measure of county new-home inventory.
Pending single-family sales also declined 17.6% to 6,445 in October 2026. Meanwhile, single-family sales over the 12 months through October totaled 87,433. Together, those figures point to slower near-term activity alongside substantial annual turnover. They describe the overall Greater Houston single-family market, not the separate resale pace of new construction in Harris, Fort Bend, or Montgomery counties.
Use the data in three steps:
Houston-area prices vary by county and neighborhood, so a regional median can hide local differences. Harris County offers one useful benchmark: in 2023, 14 neighborhoods with more than 30 new-home sales had median prices below $300,000. That identifies several active lower-priced areas, but it doesn’t mean every home in those neighborhoods sold below that threshold.
County medians and neighborhood medians answer different questions. A county figure gives a broad reference point; a neighborhood figure can better frame a specific purchase. For example, the 14 Harris County neighborhoods show that lower-priced new construction existed alongside higher-priced areas. Compare a property with nearby sales from the same period, rather than applying one countywide number to every Houston location.
Greater Houston’s broader market offers another point of reference, but it should not be mistaken for a new-build price table. These figures describe the wider single-family market, not median new-home prices for each county or neighborhood.
Construction permits also signal where higher-value development is occurring, without proving what homes ultimately sell for. Texas’s four major metropolitan areas recorded 1,900 new residential construction permits valued above $500,000 through Q1 2026. Harris County recorded 318 high-value permits during that period. Treat permit values as a construction indicator, not as a substitute for sold-price comparisons.
To compare Houston areas, keep the measures and dates aligned. Match new-home sales with other new homes, use the same neighborhood where possible, and compare the same time period. A 2023 neighborhood median and an October 2026 regional median describe different markets. They can provide context, but they shouldn’t be combined as though they were direct price comparisons.
These comparisons help put an asking price in context without assuming one Houston-wide premium. A neighborhood with lower-priced sales can still include homes at varied price points, while high-value permits indicate construction activity, not confirmed buyer demand. Make comparisons meaningful by matching nearby sales by property type and date.
Jet Lending, LLC helps real estate investors connect market research with practical deal analysis. Use the Investment Property Calculator to assess whether a Houston-area property’s purchase assumptions fit your investment goals. If the numbers support moving forward, Short-Term Loans may help finance investment-purpose real estate. Together, these tools can bring local sales patterns, price comparisons, and property-level assumptions into one decision process.
Once you’ve identified a property and want to assess its investment potential, contact Jet Lending, LLC to discuss your real estate investment plans.
A Houston new construction market analysis is most useful when it informs how you assess a specific opportunity. Move from broad market signals to the property’s assumptions: expected purchase terms, potential income or resale value, and ongoing costs. Keep your comparisons grounded in the property’s location and intended investment strategy.
Before committing, use a clear decision framework. Identify the assumptions that matter most, test how changes could affect the deal, and decide which uncertainties need more attention. A disciplined review helps distinguish an attractive headline from an investment that fits your goals. There’s no need to rush; focus on building a sound basis for your next step.
Jet Lending, LLC helps investors consider financing and analyze an investment property while evaluating their plans.
Base your next move on the property, the numbers, and the strategy you want to pursue.
Houston remains a leading market for new-home sales, while construction permits have recently declined. The city recorded 8,128 residential permits in Q1 2026, down 11% year over year. Greater Houston had a 5.5-month supply of single-family homes in October 2026. A Houston new construction market analysis should treat permits as a pipeline measure and sales, listings, and supply as separate indicators of current conditions.
Houston recorded 3,535 new-construction home sales in January and February 2026. It issued 9,239 new residential building permits during those same two months, and 8,128 permits in Q1 2026. These figures measure different stages: a permit authorizes construction, while a sale records a purchase. They shouldn’t be added together or treated as the number of completed homes currently available.
The gap can vary by neighborhood and property features, so use nearby comparable sales to assess a specific purchase.
Cypress South was a major Harris County sales concentration: almost one in five new homes sold in the county in 2023 were in that neighborhood. At the county level, Harris, Montgomery, and Fort Bend all recorded substantial new-home sales. The data points to a concentrated neighborhood example and broader county activity, rather than a definitive ranking of every Houston suburb by current construction volume.
Tags:

That shift makes careful pricing essential when avoiding bad real estate deals in Houston. A listing price is only a starting point, not proof that a property will work as an investment. It’s easy to...

Your first flip doesn’t start with a loan application. It starts with a Houston deal whose numbers make sense. If you’re figuring out how to get funding for your first flip Houston, start by building...

A promising Houston property can still make a weak funding request if the numbers, repair plan, or repayment path are unclear. For investors exploring private funding for real estate deals Houston,...